
If you want to turn SEO into a user engine, this is the part worth studying
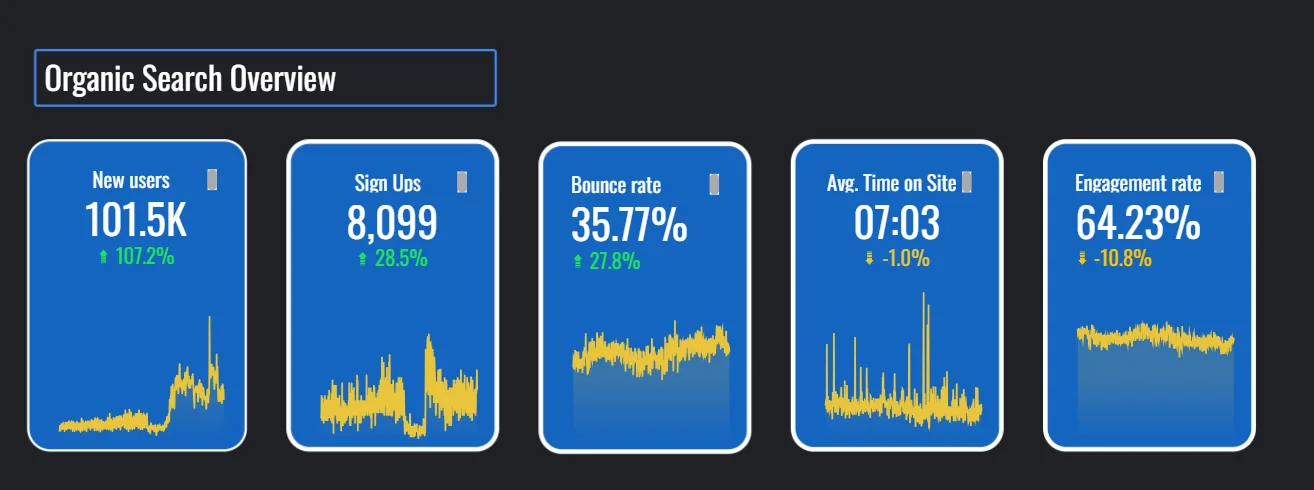
More than 50 organic pages generated 91,000 users and 7,600 sign-ups. As the channel expanded, the broader organic dashboard reached 104,400 users and 8,099 sign-ups. AI referrals added another 9,300 sessions and 618 sign-ups.

All of this happened in under two years.
But the useful lesson is not that we found a clever keyword or published at scale. The website already had hundreds of pages when we started. It had grown quickly, lost much of that visibility and reached a point where publishing more could make the problem worse.
The turnaround began when we stopped treating SEO as a production target and started treating it as a path from customer problem to product action.
The commercial outcome, not the SEO output
Here are the results, with the reporting scopes kept separate:
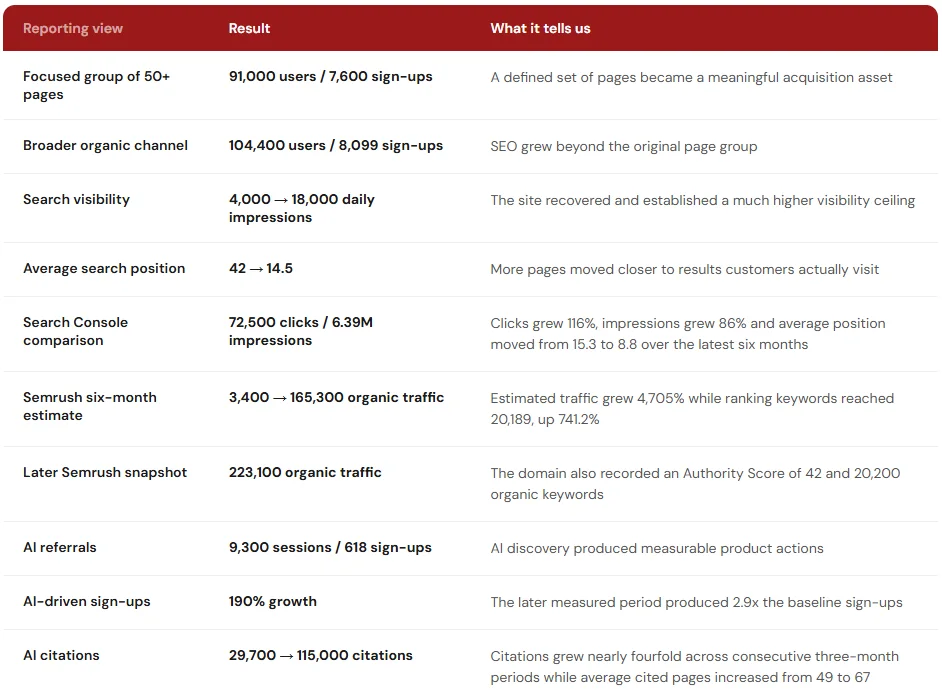
These numbers matter because they describe movement through the business, not just movement inside a search tool.
We did not add Search Console clicks or Semrush traffic estimates to the analytics user total. Each source measures something different.
For a B2B company, define the product action before building the content plan. That action might be a trial, demo, qualified lead or completed sign-up. Traffic is an input. The chosen action is how you know whether the channel is working.
Fifty pages carried most of the acquisition story
The focused group of more than 50 landing pages and articles generated 91,000 users and 7,600 sign-ups. Based on the aggregate totals, that is approximately 8.35 sign-ups for every 100 users, or about 84 sign-ups for every 1,000 users, approximately a 8.35 conversion rate.
This was the point where SEO stopped looking like a content programme.
We could now ask better questions. Which pages introduced the right users? Which subjects helped those users understand the product? Where did people continue to sign-up, and where did the journey end?
The answers affected what we updated, consolidated and supported with internal links. A page was not valuable merely because it ranked. It had to contribute to a useful path.
Founders should insist on this distinction. A page can bring in thousands of visitors and still have little commercial value. Another page can attract a smaller audience but consistently introduce people who need the product. If both are judged by traffic alone, the wrong page often receives more investment.
Do not make organic traffic the final goal. It is a sign of distribution, not proof of acquisition.
The channel kept growing beyond the original page set
The later Looker Studio view showed 104,400 organic users and 8,099 sign-ups across the wider channel. It also recorded a 35.77% bounce rate, a 64.23% engagement rate and an average time on site of 7 minutes and 3 seconds.
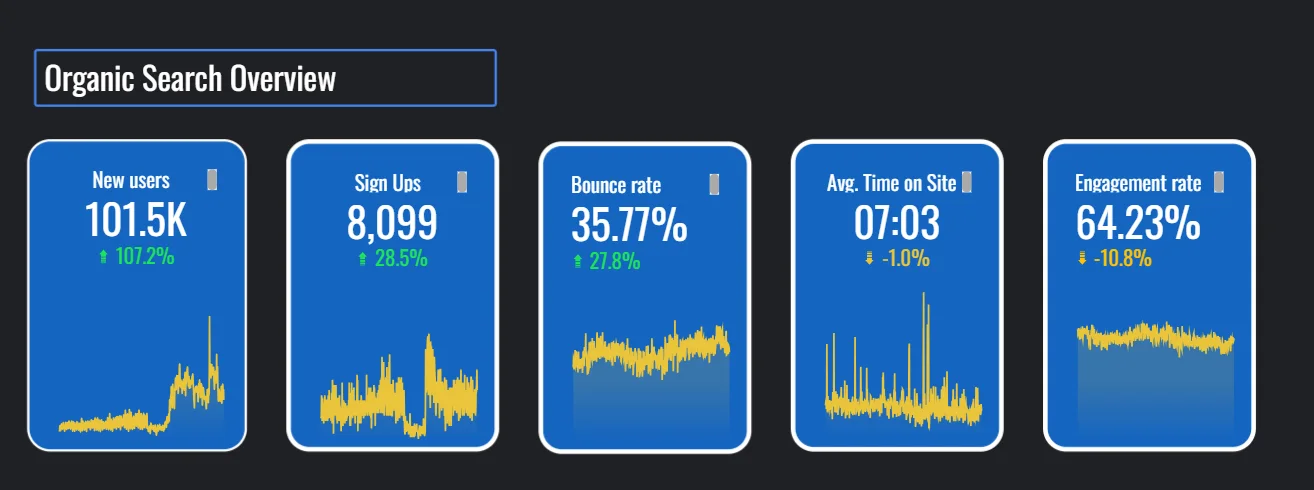
The broader totals work out to approximately 7.76 sign-ups per 100 organic users. The engagement numbers add context, but the 8,099 sign-ups remain the clearest business result.
We kept the two reporting scopes distinct. The 91,000 users and 7,600 sign-ups describe the focused page group. The larger figures describe the later, broader channel. Combining them would create a bigger-looking number, but a less trustworthy case study.
The lesson is simple. Use page groups to understand which strategy is working. Use the channel view to understand whether SEO is becoming important to the company. You need both, but they answer different questions.
Search clicks grew 116% in six months
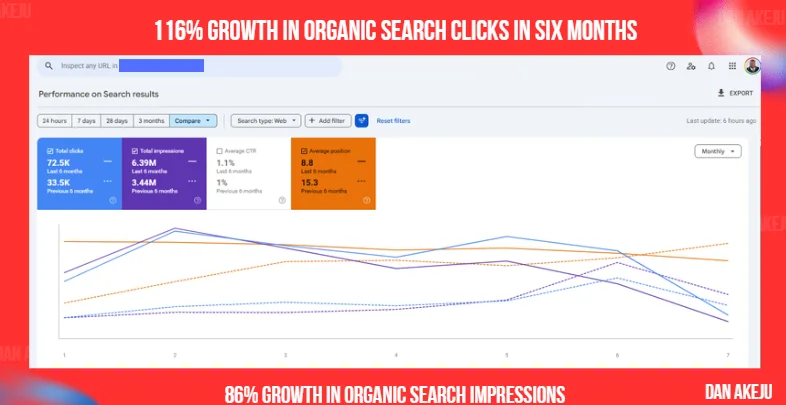
Google Search Console recorded 72,500 clicks in the latest six-month period, up from 33,500 in the previous six months. Impressions increased 86% from 3.44 million to 6.39 million, while average position improved from 15.3 to 8.8.
Semrush estimated traffic growth at 4,705%
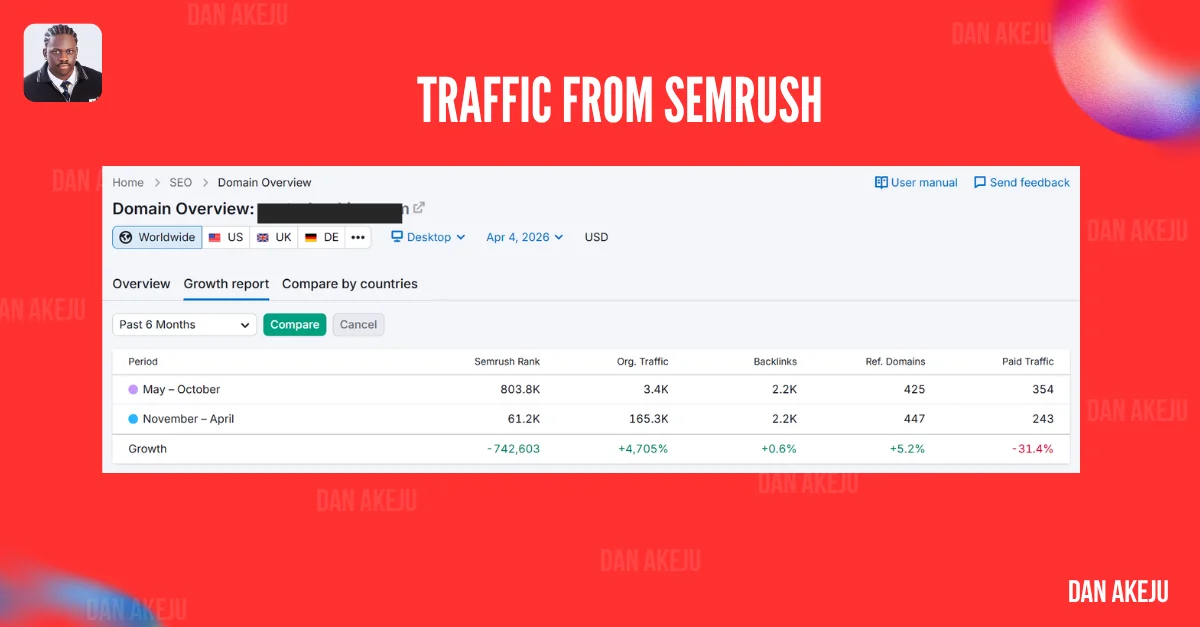
Semrush estimated organic traffic rising from 3,400 to 165,300 between the two six-month periods. The estimate is not the same as analytics traffic, but it independently confirms the scale and direction of the visibility growth.
Ranking keywords increased 741.2%
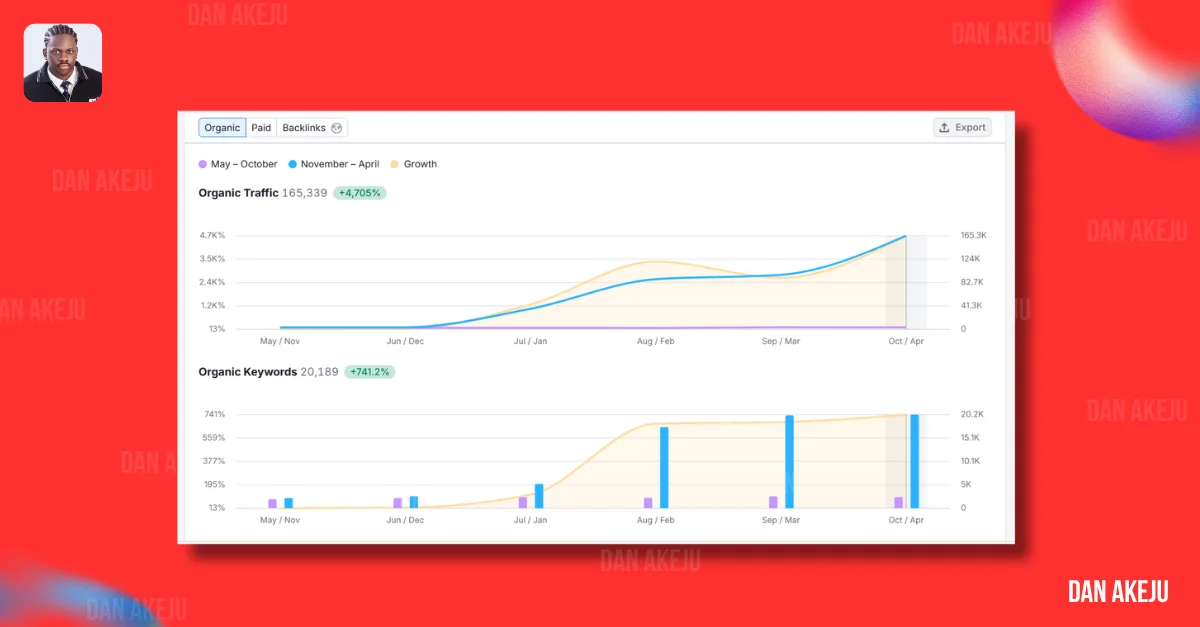
The number of organic keywords tracked by Semrush reached 20,189, an increase of 741.2%. The important part was not ranking for more terms alone, but expanding the number of searches capable of introducing relevant users to the company.
Semrushs traffic estimate later reached 223,100
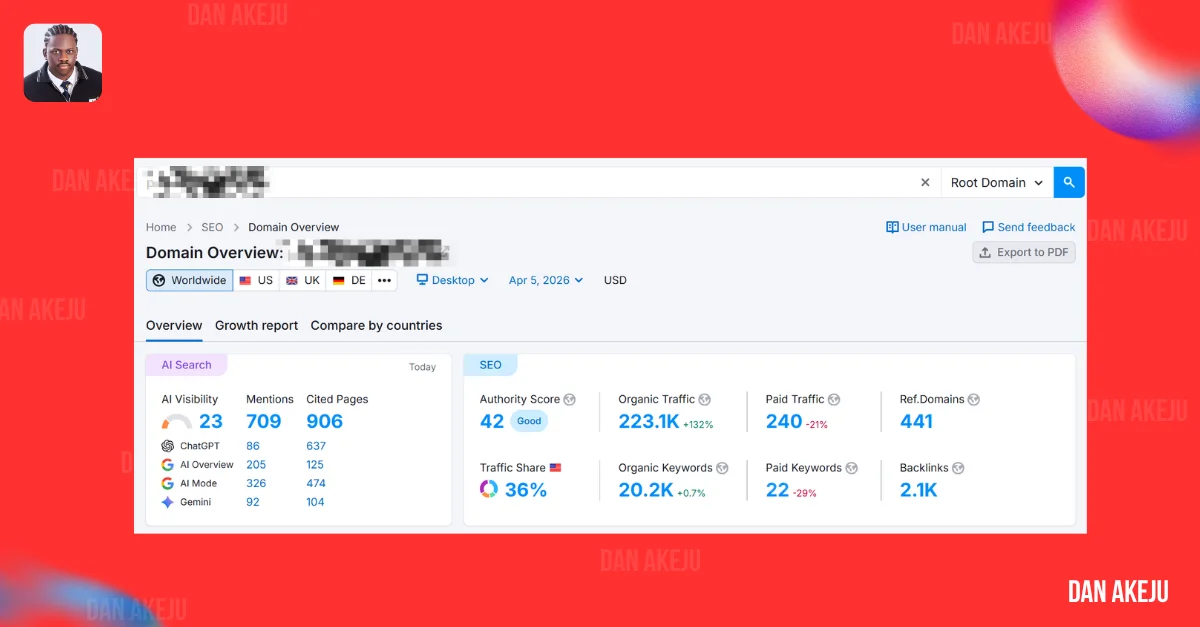
A later Semrush snapshot estimated organic traffic at 223,100, recorded 20,200 ranking keywords and gave the domain an Authority Score of 42. This showed that the earlier growth had continued beyond the original comparison period.
Before growth, we had to reverse the decline
The finished dashboard hides the difficult part.
The site had already experienced a rapid rise in visibility, followed by a collapse. More than 100 low-value pages needed attention. Several pages were targeting overlapping intent, so the website was competing with itself while continuing to dilute its useful content.
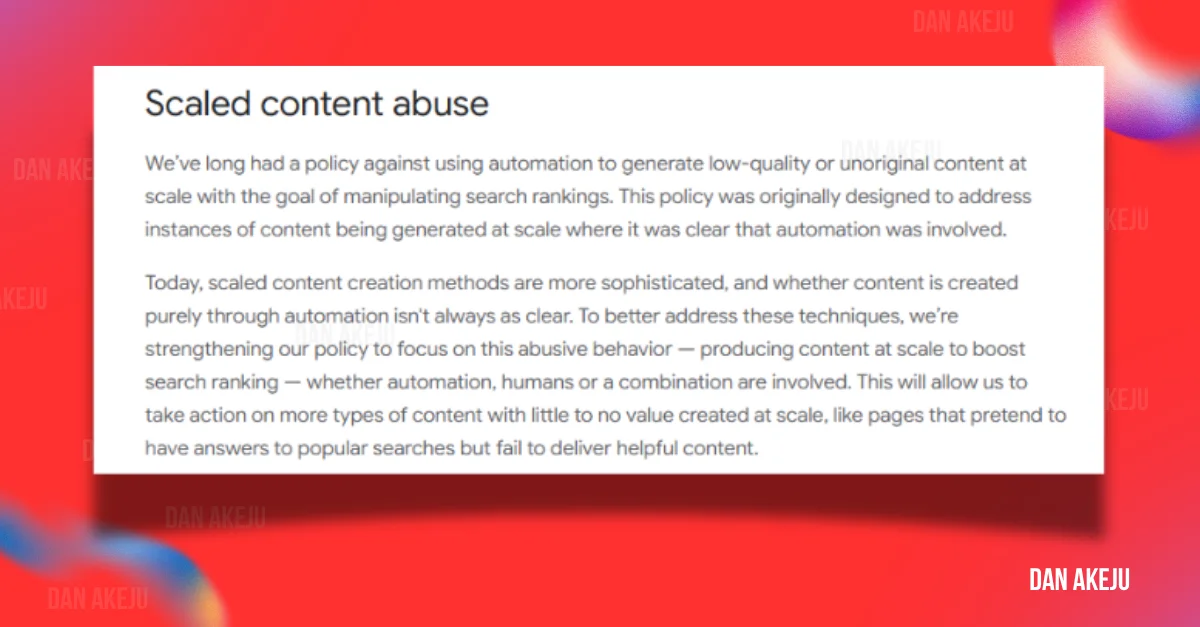
The tempting response was to publish our way out of the decline. We chose to slow down.
We removed pages that could not justify their place, consolidated pages addressing the same demand and became more selective about new content. It felt like going backwards because publishing is visible and removal can look like lost work.
In this case, subtraction gave the remaining pages room to recover.
The recovery was not linear:
- Daily impressions were nearly 4,000 in August 2024.
- They crossed 11,000 by October 14, 2024.
- They settled around 6,000 to 8,000 during December.
- They reached approximately 12,000 in March 2025.
- They later peaked at 18,000 in September 2025.
- Further peaked at 44,000 in April 2026.
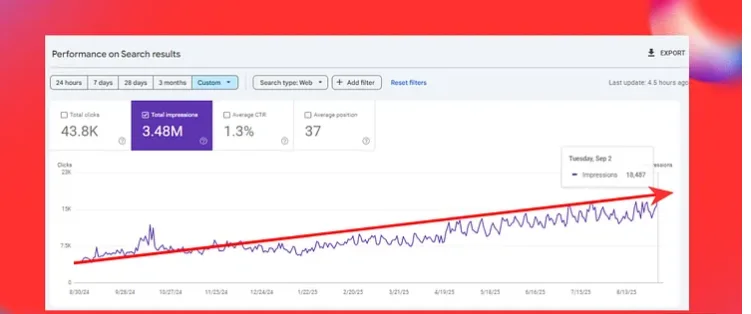
The move from 4,000 to 18,000 represents a 350% increase from the original baseline. More importantly, the pause in December showed why recovery should not be judged from one good week.
Search engines needed time to crawl the revised site, process the consolidation and reassess the remaining pages.
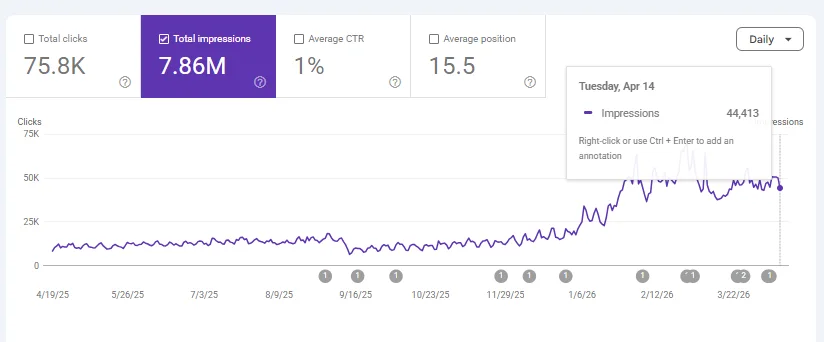
When organic visibility collapses, pause production before adding another batch of content. First determine whether the site has a coverage problem or a quality problem. More publishing helps the first problem. It usually amplifies the second.
Better rankings created an opportunity, not the outcome
Average search position improved from roughly 42 to 14.5. That is a movement of about 27.5 positions and a roughly 65% reduction in the average position number.
At position 42, much of the site was effectively invisible. Moving closer to the first page increased the opportunity to reach customers, but it did not mean those customers would care.
We do not attribute the improvement to one isolated change. Content consolidation, publishing control, internal structure and technical performance all changed during the recovery. The ranking result belonged to the system.
Use rankings as a diagnostic measure. They tell you whether distribution is improving. They do not tell you whether the improved distribution reached the right audience or produced a useful action. That is why the sign-up data sits beside the search data, not beneath it as an afterthought.
Technical performance removed friction from the journey
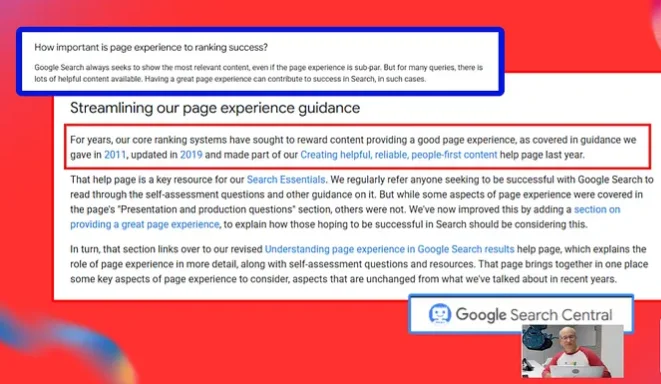
At one point, LCP measured above 40 seconds on a tested page. A visitor could find the right result, click it and leave before the main content became usable.
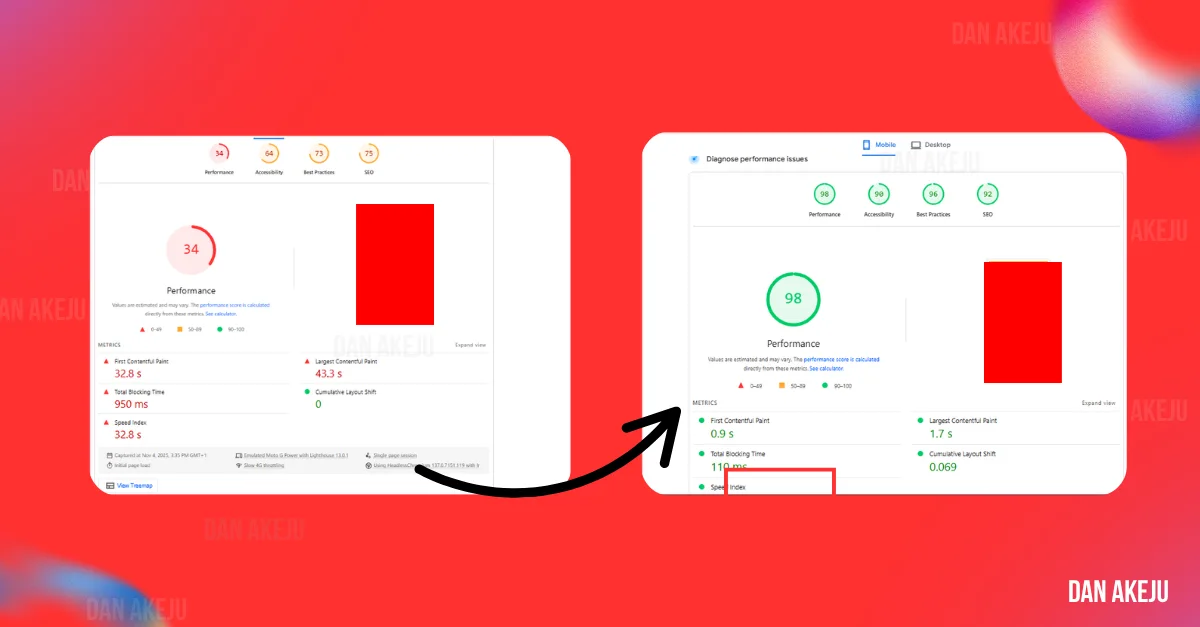
We prioritized the main image, deferred non-essential third-party scripts, removed unused CSS that blocked initial rendering and cleaned old WordPress revisions and database overhead.
A later test recorded LCP near 2 seconds, more than 38 seconds faster than the earlier tested page.
That change did not create the acquisition strategy. It removed a barrier that prevented the strategy from working.
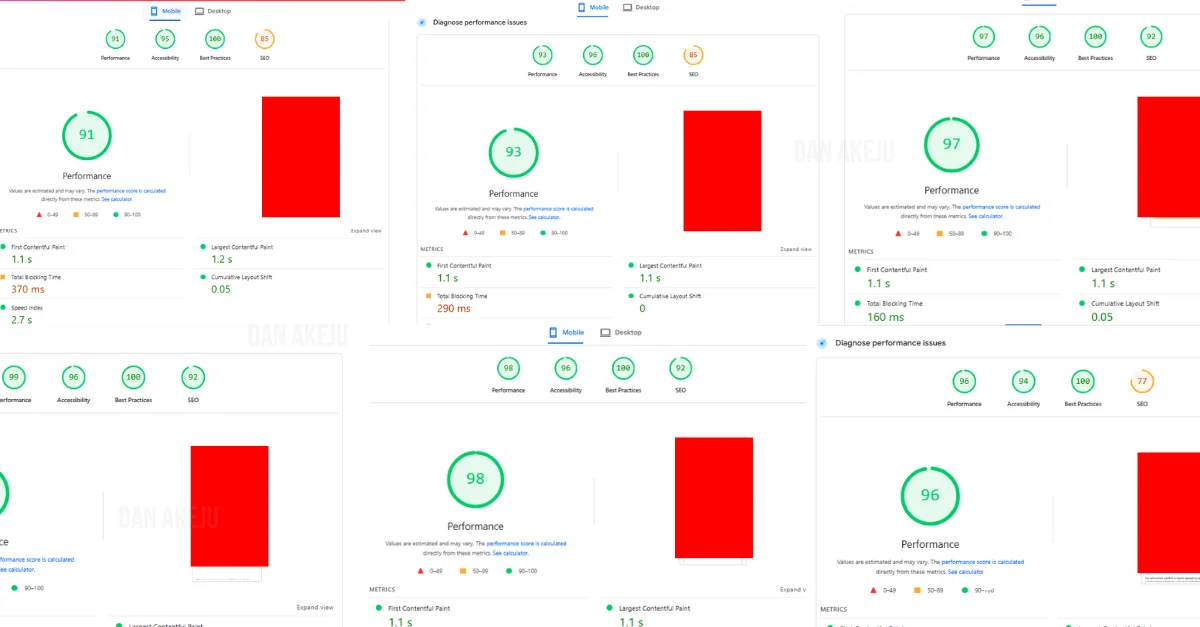
This is the right role for technical SEO. Do not optimize a performance score just to turn a dashboard green.
Find the delay a real customer experiences, remove it and then check whether engagement and product actions improve with it.
AI discovery Became Measurable Acquisition
AI referrals produced 9,300 sessions and 618 sign-ups. The same reporting view recorded a 41.67% bounce rate, a 58.33% engagement rate and an average time on site of 6 minutes and 27 seconds.
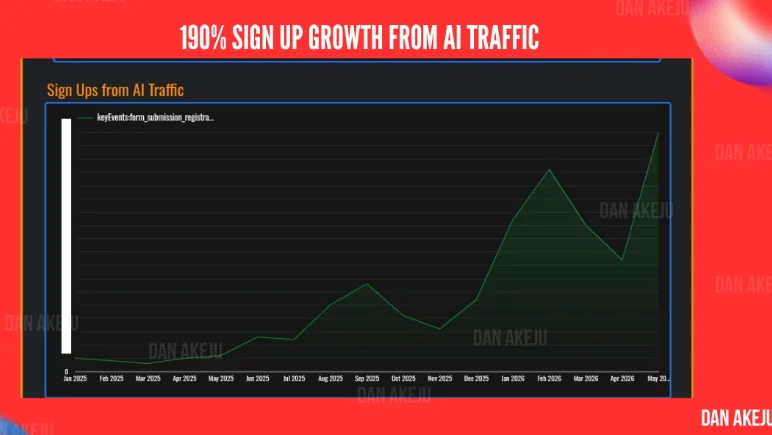
Based on sessions, that is approximately 6.65 sign-ups for every 100 AI referrals. A separate period comparison showed AI-driven sign-ups increasing by 190%, meaning the later period produced 2.9 times the baseline.
AI Citations Grew nearly Fourfold in 90 days
Citations across Microsoft Copilot and its partners increased from 29,700 in one three-month period to 115,000 in the next. Average cited pages rose from 49 to 67.
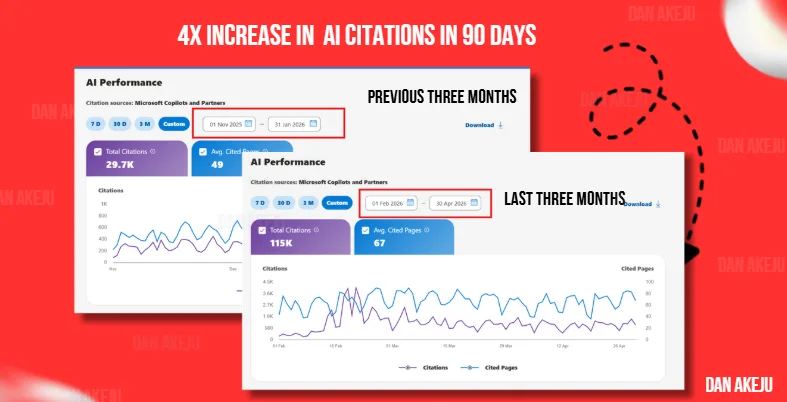
The meaningful result was not that an AI platform mentioned the company. It was that people followed those recommendations, reached the site and signed up.
We tracked AI referrals separately because they behaved differently from traditional search. That let us see which landing pages received the visits and whether the traffic created curiosity or genuine product interest.
Companies measuring AI visibility should follow the user beyond the citation. Mentions are useful evidence of discovery. Sessions show that someone acted on the recommendation. Sign-ups show that the recommendation reached a relevant person.
The Strategy Gave Every Page an Economic role
Three ideas held the system together: categorical quality, core and outer content, and search-to-product fit.
Categorical quality was our operating principle for judging the website as a whole. It was not an official search engine score. It meant every page had to make the site more useful within the category.
We organized content into two connected sections.
The core section contained the pages closest to monetizable demand.
These served people evaluating a solution, exploring a product-relevant use case or trying to complete a task the software supported.
The outer section answered broader questions the same ideal customer asked around the category. These pages could gather visibility and historical performance data faster, reveal which subjects earned engagement and support the more competitive core pages.
The outer section was not a licence to chase random high-volume topics. Its value came from the connection. Outer pages created relevant discovery and passed context and interested users towards the core.
Core pages turned the relevant part of that attention into product consideration and sign-ups.
For a B2B site, the practical question is not simply, “Can we rank for this?” Ask, “If the right person lands here, is there a natural reason to move towards the product?” That is search-to-product fit.
Weak search-to-product fit produces impressive traffic with nowhere useful to go. Strong fit makes the product a logical next step without forcing a sales message into every paragraph.
The Customer Journey Determined What we Published
We mapped the ideal customer’s questions from awareness to action before deciding which content deserved investment.
Real journeys were not perfectly linear. Some visitors moved from an outer page to sign-up in one session. Others returned through several pages. The map gave us a planning model, not a claim that every buyer behaved the same way.
The useful discipline was that every page needed a defined customer, stage and next action. That kept awareness content from becoming vague and prevented action pages from trying to rank for every possible question.
Before opening a keyword tool, write down the questions your ideal customer asks at each stage. If a proposed page does not fit the journey or strengthen another page that does, reconsider why it needs to exist.
Measurement Kept the Strategy Honest
The Looker Studio dashboard connected organic and AI discovery to users or sessions, sign-ups, bounce rate, average time on site and engagement rate.
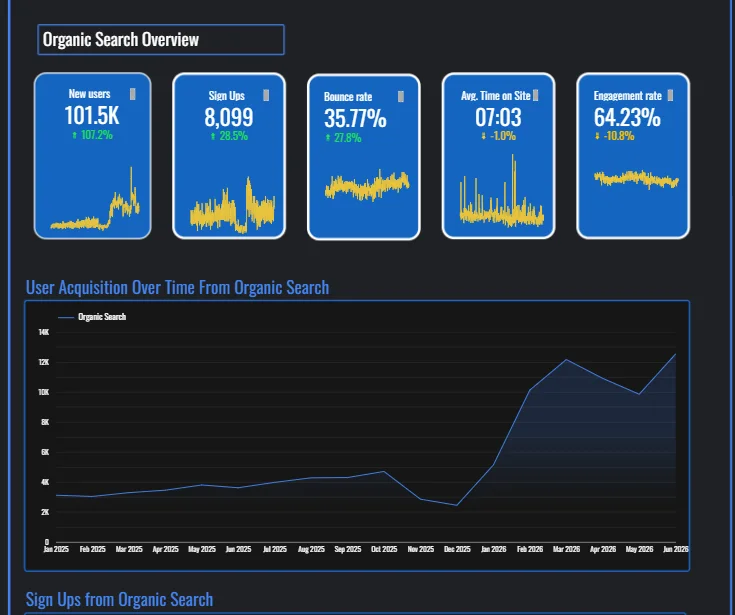
It was not built to display every available metric. It helped us make decisions.
A page gaining traffic without sign-ups prompted a closer look at intent and the route into the product. A lower-traffic page producing consistent sign-ups could justify more support from the outer section.
A ranking improvement with weak engagement suggested that visibility had moved faster than relevance.
The dashboard had to answer three questions:
- Which pages bring the right people into the website?
- Which pages move those people closer to the product?
- Which pages produce the final product action?
If a metric does not change a decision, it probably does not deserve the founder’s attention.
Why these results are hard to ignore
In under two years, the organic channel produced:
- 104,400 users and 8,099 sign-ups
- 72,500 Search Console clicks and 6.39 million impressions in the latest six months
- 4,705% growth in Semrush’s estimated organic traffic
- 9,300 AI sessions and 618 additional sign-ups
- A 190% increase in AI-driven sign-ups
- Nearly four times more AI citations across consecutive three-month periods
The company did not simply gain rankings. It built a repeatable route from search demand to product sign-up.
That is the competitive pressure. While one company is still discussing whether SEO is worth the investment, another can spend that time acquiring users and strengthening the pages already producing them.
The Principle Founders Should Keep
This company did not need SEO to become better at producing pages. It needed SEO to become better at producing users.
That required us to remove more than 100 weak or overlapping pages, rebuild the site around the customer’s journey, connect broad discovery to monetizable content, improve delivery and measure sign-ups alongside visibility.

The result was 104,400 organic users, 8,099 sign-ups and a growing AI acquisition channel that added 618 sign-ups of its own.
The larger lesson is not to copy the page count or the exact content structure. It is to give every part of SEO a commercial role.
When search moves the right person from a real problem to a useful answer, then from that answer to the product, it stops being a traffic programme.
It becomes a user engine.